
This tutorial shows how Accumulation Distribution Expert Advisor can be used on charts of MT4 to Trade.
Strategy Premise
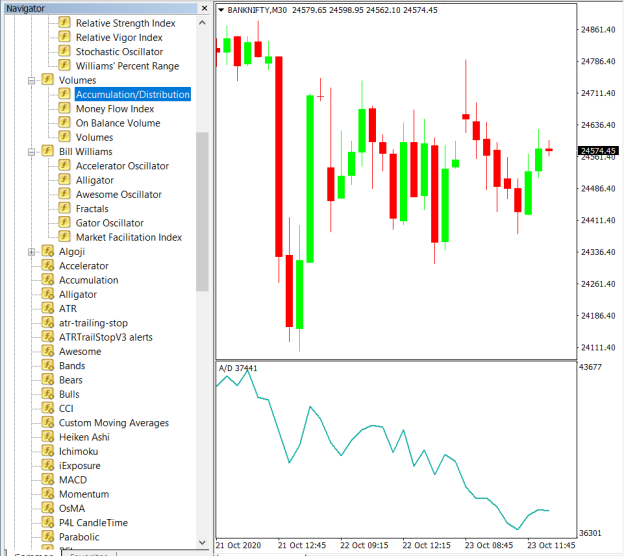
The accumulation/distribution line or accumulation/distribution index is a technical analysis indicator intended to relate price and volume in the stock market and acting as a leading indicator of price movements. A rising A/D line helps confirm a rising price trend. A falling A/D line helps confirm a price downtrend. If the price is rising but A/D is falling, it signals underlying weakness and a potential decline in price. If the price of an asset is falling but A/D is rising, it signals underlying strength and the price may start to rise.
Strategy Logic
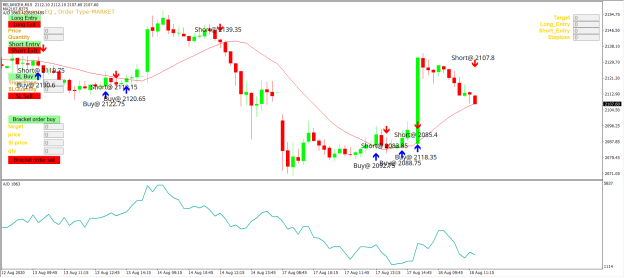
Long Entry: When Moving average is below the Candles and A/D Value is More than the Last Candle (Increasing)
Long Exit: Exit happens with Short Entry
Short Entry: When Moving average is Above the Candles and A/D Value is Less than the Last Candle (Decreasing)
Short Exit: Exit happens with Long Entry
MT4 Settings
To start Algo trading with Accumulation Distribution on MT4, simply follow the steps given below.
- Make sure you have completed Jump Start setup
- Download zipped files from here and extract them. You will find three sub-folders: Experts, Indicators and Include. The files in these sub-folders should be copied in your MT4 directory in the same folders. In MT4 Click on File => Open Data Folder=> Click on MQL4 => Experts folder. Copy-paste the downloaded file to the Expert folder.
- (Optional, if indicator nor present in your MT4) In MT4 Click on File => Open Data Folder=> Click on MQL4 => Indicator folder. Download the Indicator file from here and copy-paste in your Indicator folder. Also paste files to your Include folder if not already present.
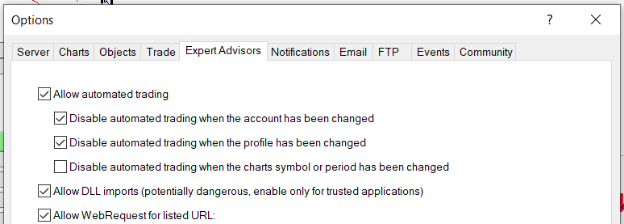
- In MT4 => Tools => Expert Advisor => Check all option available as shown below.
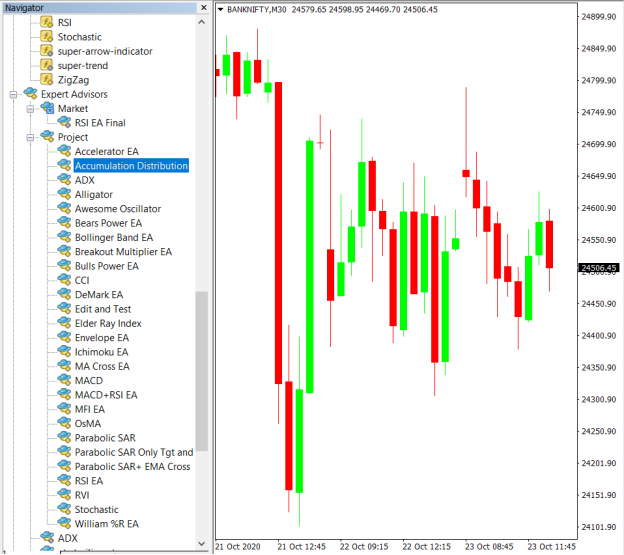
5. Go to navigator click on refresh to refresh indicator and expert advisor.
Now put Accumulation Distribution Expert Advisor on chart
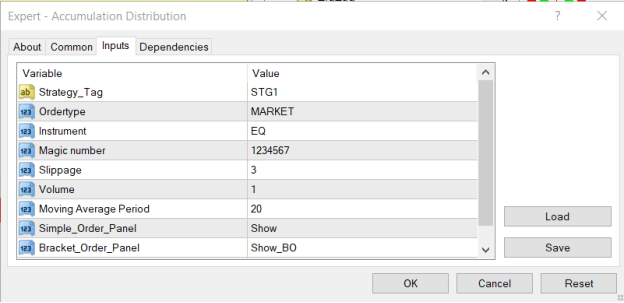
Step 7: Change the Input Parameters as per your Requirement
Step 8: Now put the Accumulation Distribution Indicator And Simple Moving Average on the chart and Change the Parameter as per the Inputs Set in EA.
Please note that the input parameters of EA and the indicator should be the same, or the signal generation will not match with the indicator.
Strategy Parameters
Strategy tag – use default STG1 unless trading in multiple strategies
Quantity- You Can also specify Qty in Bridge->Symbol Settings, it will override the Qty given here
Moving Average Period- Period for Simple Moving Average
Instrument – Set the instrument as per APIBridge
Magic Number- Leave at Default Value (1234567)
Slippage- Set Slippage value or Leave at Default
Volume- Lot Size
Recent Discussion