
This tutorial shows how to use MACD+RSI Expert Advisor on charts of MT4 to Trade.
Strategy Premise
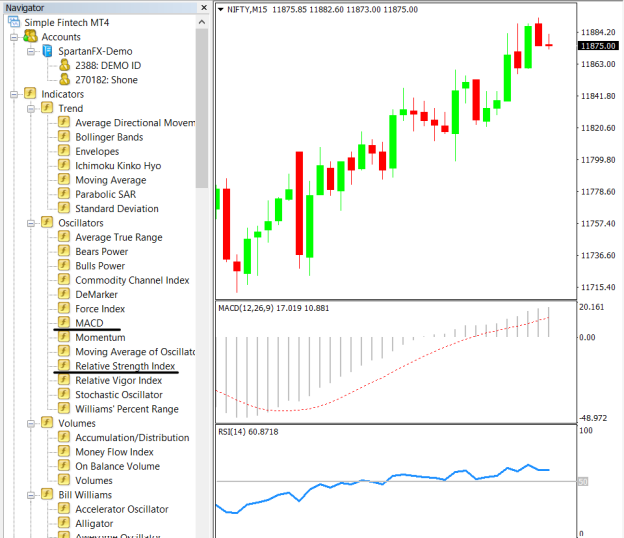
Moving Average Convergence Divergence (MACD) is a trend-following momentum indicator. It shows the relationship between two moving averages of a security’s price. The MACD is calculated by subtracting the 26-period Exponential Moving Average (EMA) from the 12-period EMA.
The relative strength index (RSI) is a momentum indicator used in technical analysis that measures the magnitude of recent price changes to evaluate overbought or oversold conditions in the price of a stock or other asset. The RSI is displayed as an oscillator and can have a reading from 0 to 100.
Strategy Logic
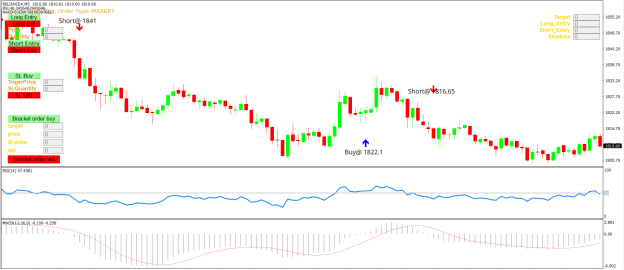
Long Entry: When MACD is above 0 and RSI is above 50
Long Exit: Exit happens with Short Entry
Short Entry: When MACD is Below 0 and RSI is Below 50
Short Exit: Exit happens with Long Entry
MT4 Settings
To start Algo trading with MACD+RSI on MT4, simply follow the steps given below.
- Make sure you have completed Jump Start setup
- Download zipped files from here and extract them. You will find three sub-folders: Experts, Indicators and Include. The files in these sub-folders should be copied in your MT4 directory in the same folders. In MT4 Click on File => Open Data Folder=> Click on MQL4 => Experts folder. Copy-paste the downloaded file to the Expert folder.
- (Optional, if indicator nor present in your MT4) In MT4 Click on File => Open Data Folder=> Click on MQL4 => Indicator folder. Download the Indicator file from here and copy-paste in your Indicator folder. Also paste files to your Include folder if not already present.
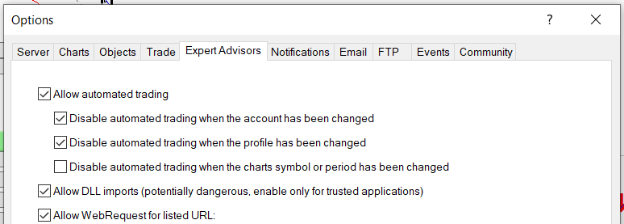
- In MT4 => Tools => Expert Advisor => Check all option available as shown below.
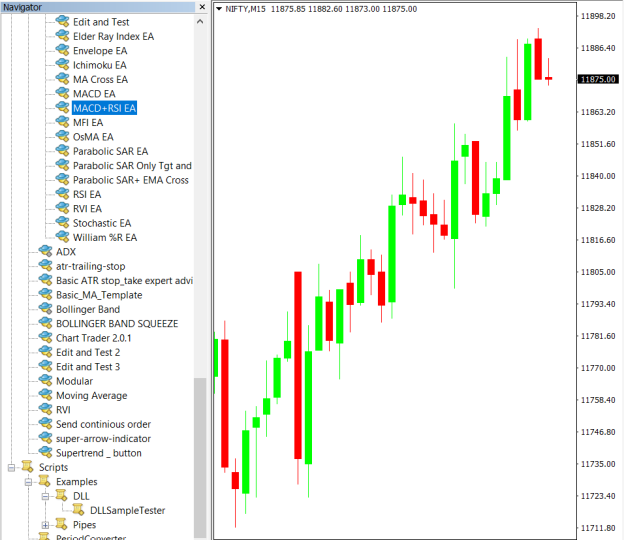
5. Go to navigator click on refresh to refresh indicator and expert advisor.
6. Now put MACD+RSI Expert Advisor on chart .
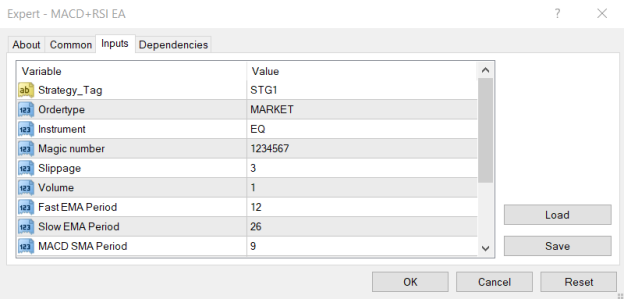
7. Change the Input Parameters as per your Requirement
8. Now put the MACD and RSI Indicator on the chart and Change the Parameter as per the Inputs Set in EA.
Please note that the input parameters of EA and the indicator should be the same, or the signal generation will not match with the indicator.
Strategy Parameters
Strategy tag – use default STG1 unless trading in multiple strategies
Quantity- You Can also specify Qty in Bridge->Symbol Settings, it will override the Qty given here
Instrument – Set the instrument as per APIBridge
Magic Number- Leave at Default Value (1234567)
Slippage- Set Slippage value or Leave at Default
Volume- Lot Size
Fast EMA Period- Fast EMA Period for MACD
Slow EMA Period- Slow EMA Period for MACD
MACD SMA Period- SMA Period for MACD
RSI Overbought Level- Overbought Level for RSI
RSI Oversold Level- Oversold Level for RSI
Recent Discussion