
This tutorial shows how Parabolic SAR Expert Advisor can be used on charts of MT4 to Trade.
Strategy Premise
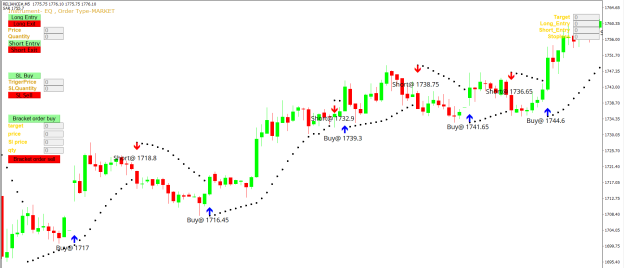
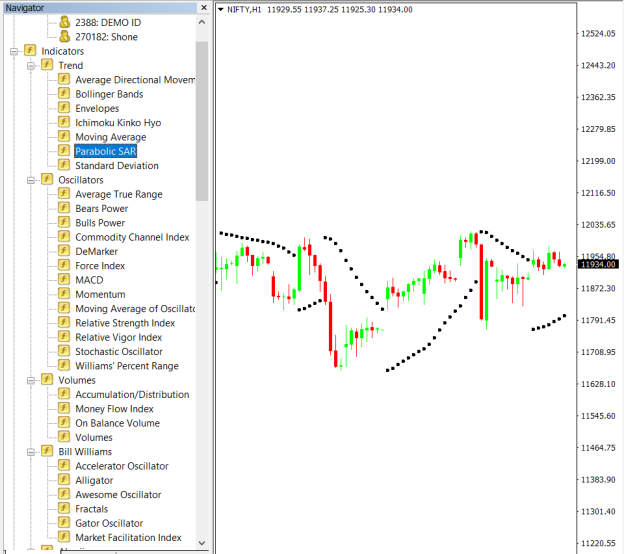
Parabolic Stop and Reverse (SAR) is a trailing stop-based trading system. The SAR uses a trailing stop level that follows prices as they move up or down The indicator is usually shown as a series of dots above or below the price bars. The dots are the stop levels. You should be short when the stops are above the bars; you should be long when the stops are below the bars.
Strategy Logic
Long Entry: When Value of Parabolic SAR is Below the Candles
Long Exit: Exit happens with Short Entry
Short Entry: When Value of Parabolic SAR is Above the Candles
Short Exit: Exit happens with Long Entry
MT4 Settings
To start Algo trading with Parabolic SAR on MT4, simply follow the steps given below.
- Make sure you have completed Jump Start setup
- Download zipped files from here and extract them. You will find three sub-folders: Experts, Indicators and Include. The files in these sub-folders should be copied in your MT4 directory in the same folders. In MT4 Click on File => Open Data Folder=> Click on MQL4 => Experts folder. Copy-paste the downloaded file to the Expert folder.
- (Optional, if indicator nor present in your MT4) In MT4 Click on File => Open Data Folder=> Click on MQL4 => Indicator folder. Download the Indicator file from here and copy-paste in your Indicator folder. Also paste files to your Include folder if not already present.
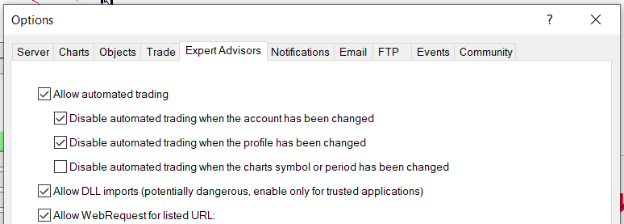
- In MT4 => Tools => Expert Advisor => Check all option available as shown below.
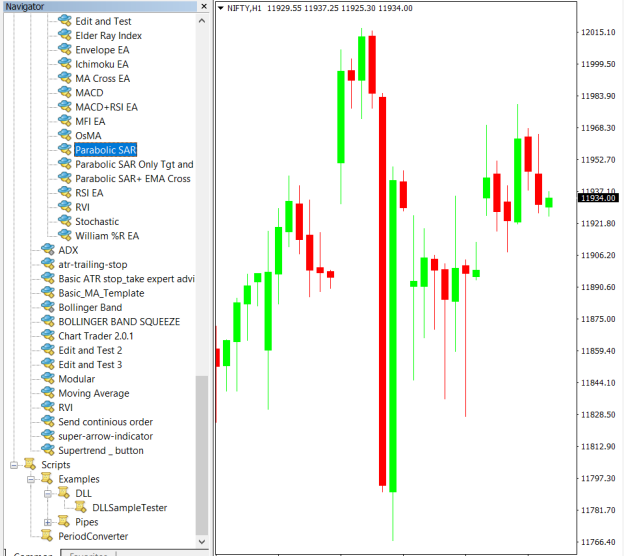
5. Go to navigator click on refresh to refresh indicator and expert advisor.
6. Now put Parabolic SAR Expert Advisor on chart
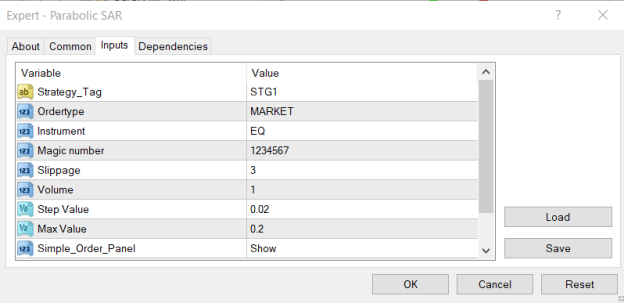
7. Change the Input Parameters as per your Requirement.
8. Now put the Parabolic SAR Indicator on the chart and Change the Parameter as per the Inputs Set in EA.
Please note that the input parameters of EA and the indicator should be the same, or the signal generation will not match with the indicator.
Strategy Parameters
Strategy tag – use default STG1 unless trading in multiple strategies
Quantity- You Can also specify Qty in Bridge->Symbol Settings, it will override the Qty given here
Instrument – Set the instrument as per APIBridge
Magic Number- Leave at Default Value (1234567)
Slippage- Set Slippage value or Leave at Default
Volume- Lot Size
Step Value- Step Value of Parabolic SAR (0.02)
Max Value-Max Value of Parabolic SAR (0.2)
Recent Discussion