
Creating Excel strategy with live data can be easily done, here is how you can create your first Excel Strategy. If you are already using Excel for Analysis, you can merge your existing sheet for deploying strategies in Technical Analysis, Option Chain Analysis, Pair Trading etc.
We will start by showing you how to deploy a simple strategy based on support and resistance levels.
Understanding Excel Plugin:
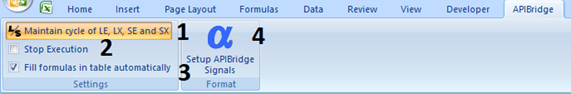
Stop Execution:
Before you configure your settings, it is recommended to tick “Stop Execution”, because accidental trades may be fired on changing values in cells. Untick it when you are ready to start trading.
Maintain cycle of LE, LX, SE, and SX
You may turn it on by clicking on it. If this text appears in the highlighted background, it means it is turned on. It enables two rules:
- Any two types of consecutive signals will not be sent. For example: if LE triggers after LE from the same row, it will be ignored. After LE the system will wait for LX. And after LX, the system will again wait for LE. Similarly, the cycle of SE and SX is maintained. There is no relation between LE and SE.
- LX comes only after LE; SX comes only after SE
If you want to do position sizing, scale-in, or scale-out, you can keep it turned off.
This helps you stop firing wrong signals.
Fill formulas in the table automatically
Changing of formula can result in a change in the whole column in a table. If you want to avoid this, you can untick.
Sequence of Columns
Do not change the sequence of any pre-defined columns. The columns with A- heading refer to the Signal Data which will be sent to APIBridge.
The columns of left of A-columns are a few pre-defined which you can use for live data. You can insert any number of columns by expanding the F column.
The columns A-SigType, A-Price, and A-Symbol are mandatory columns to trade via APIBridge, all other are optional.
Adding Live Data
You can plug data from any source like Nest, NOW, ODIN, or use a data vendor. For illustration purposes, we are using here Nest trading terminal.
Please Note: You cannot use Sharekhan TT, because it locks Excel. Fyers ONE cannot be used for live data to Excel; because login to Fyers ONE breaks the connection with Fyers API.
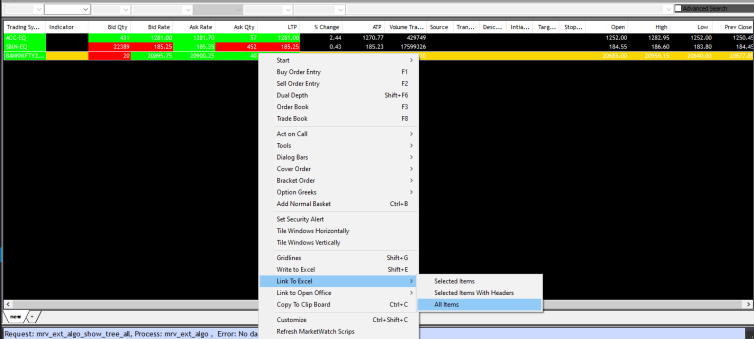
1. log in to your Nest account and load your watch list. Right-click on the watchlist, Select Link to excel -> All items.
This will copy all symbols information.
2. Run Excel as Administrator (Important)
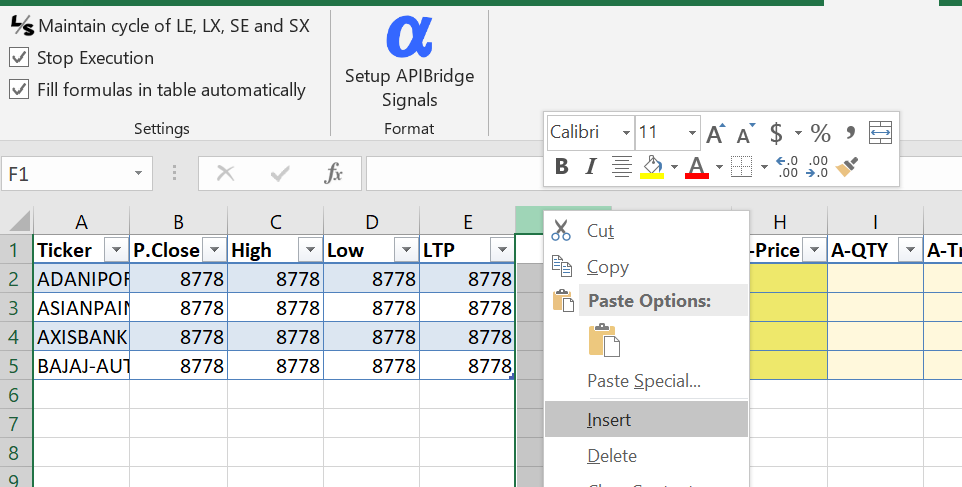
3. After starting Excel, open sample.xlsx that you downloaded in Excel setup files.
4. Paste (Ctrl+v) in Sheet 2 or any new sheet
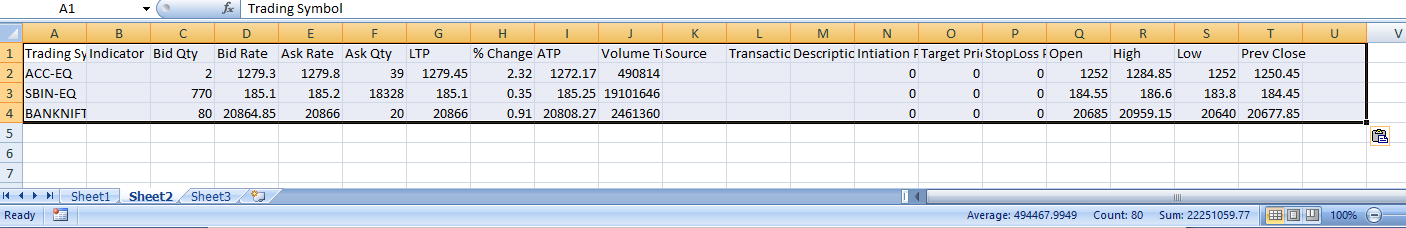
5. Now simply copy in Sheet 2, and paste in Sheet 1
6. Click Setup APIBridge Signal. You are ready to define strategy rules!
Signal Trigger Rules
This sampling strategy triggers LE if LTP goes above Resistance and triggers LX if LTP goes below Support. Define the following Symbol Settings in APIBridge for AXISBANK (example).
In column A-SigType, add the below formula.
=IF(E4 > G4, "LE", IF(E4 < F4,"LX","NA"))
Also In the A-price and A-trip price, type 0 because we will first send market orders. In A-Qty just put 1; define quantity in Symbol Settings in APIBridge. n A-Symbol put AXISBANK.
All set! uncheck Stop Execution and the system will trade when conditions are met.
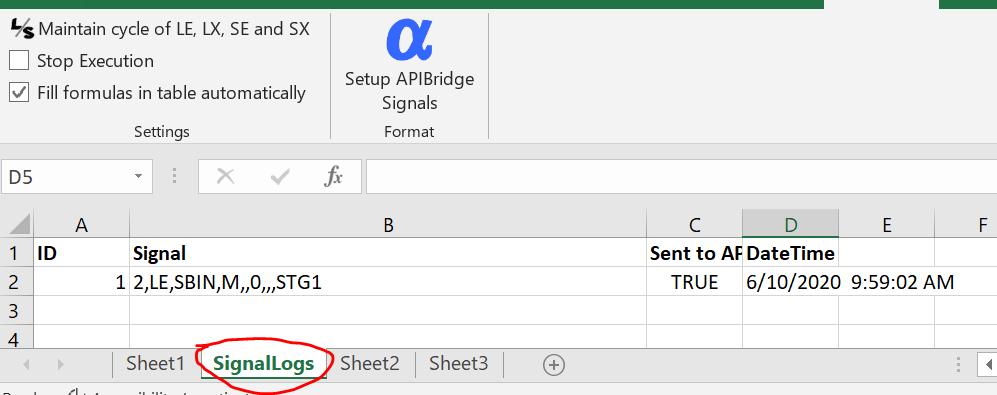
You can see the sent signals under the tab SignalLogs
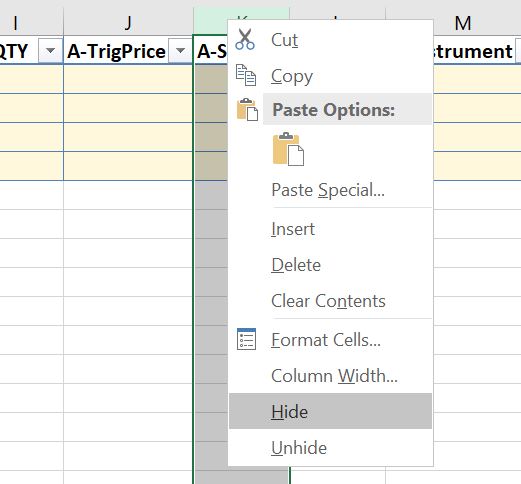
Note 1: you can hide the A-columns which you do not use
Note 2: Nest RTD issue discovered with x64 bit office. After opening excel as administrator, you will see #N/A when linking to excel. You can resolve this by running this registry file and restart the system.
How to place order on options based on underlying using Excel