
Here you can read about the following :
- Excel SuperTrend Spreadsheet
- SuperTrend Signal Conditions
- Live Data settings
- SuperTrend Spreadsheet
- Settings and Plotting SuperTrend Chart in Excel.
Here you can use the spreadsheet to pull live prices from Yahoo. Or from your broker terminal. The sheet is ready for Algo Trading with APIBridge. To know more about APIBridge click here.
Live Data Settings
If you are pulling live data from Yahoo (default), select the name of the symbol same as yahoo finance.
https://in.finance.yahoo.com/quote/%5ENSEI/components?p=%5ENSEI
The first step is to open APIBridge. Now use the yahoo symbol name you selected as the Input Symbol (should be the same as what you’ll enter in the excel file later). Setup the Exchange Symbol of the corresponding component.
Click on “start trading” once APIBridge is set up. On opening the VBA workbook, enable all permission prompts if they pop.
SuperTrend Spreadsheet Settings
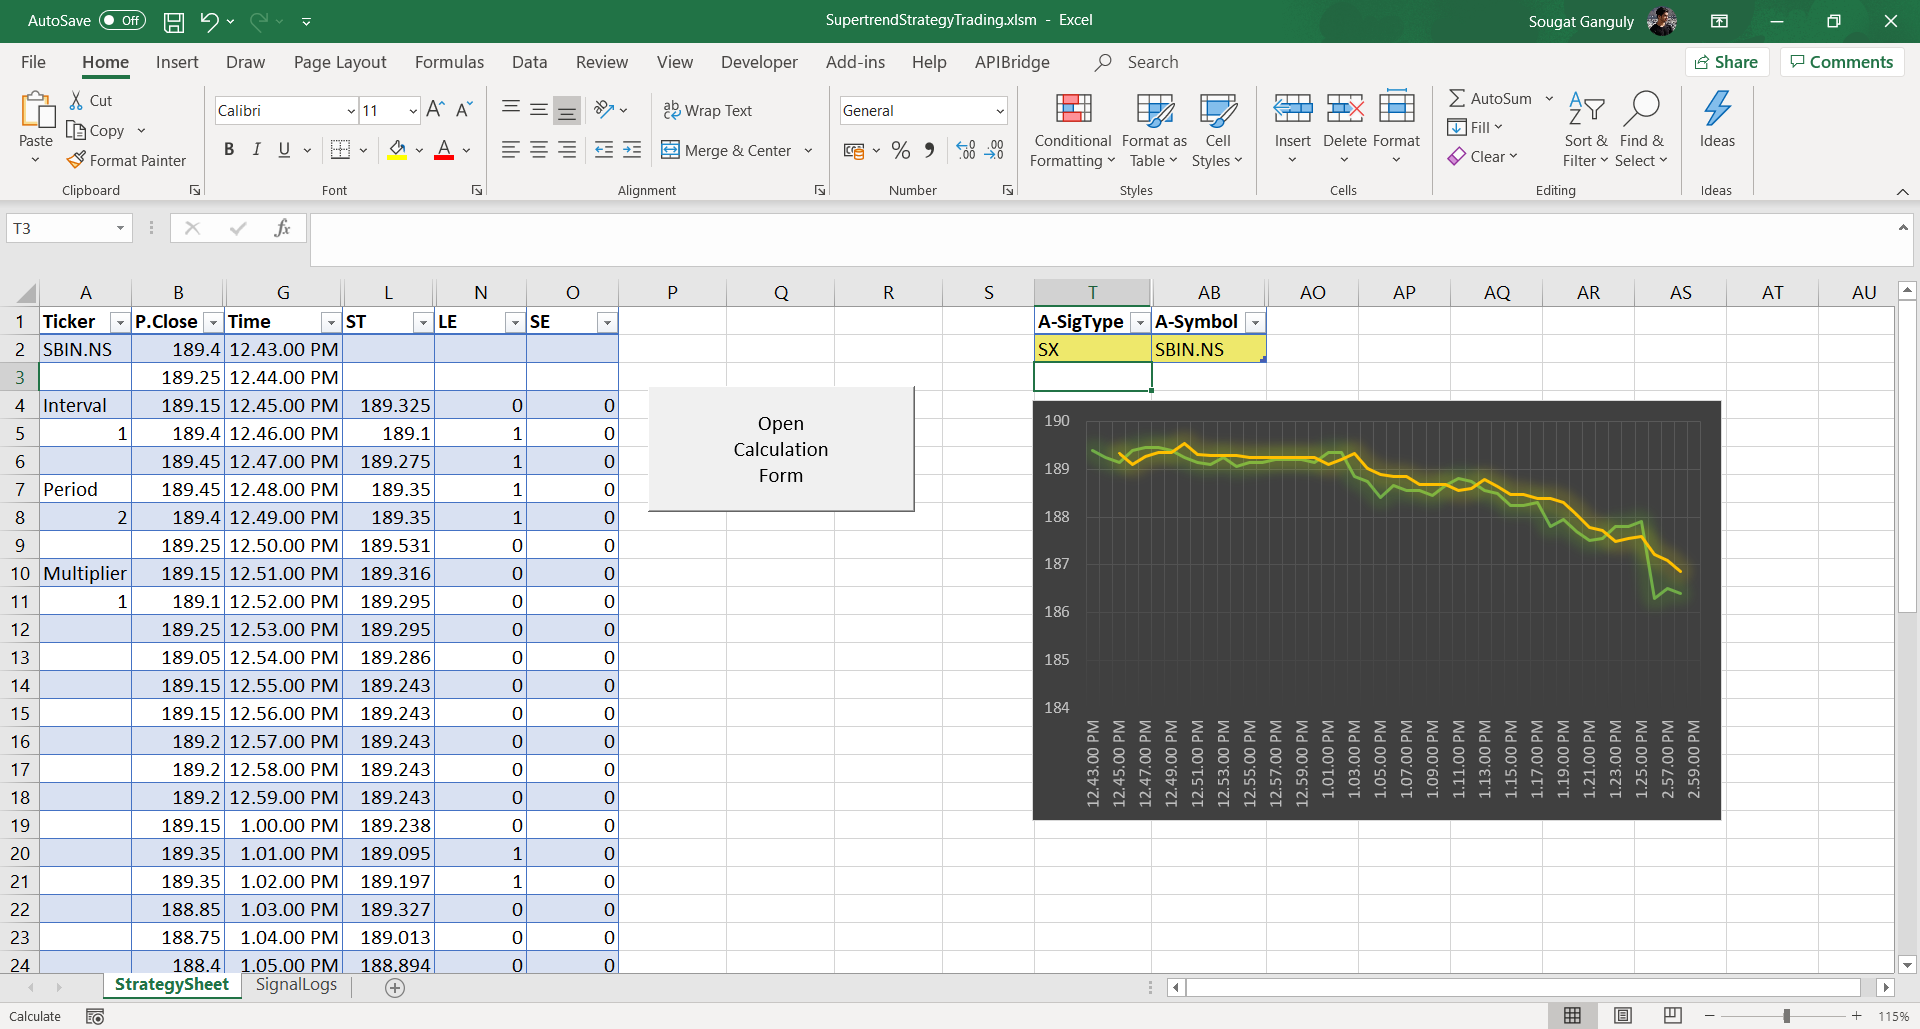
Click on the ‘Open Calculation Form’ button and a prompt dialog box will appear.
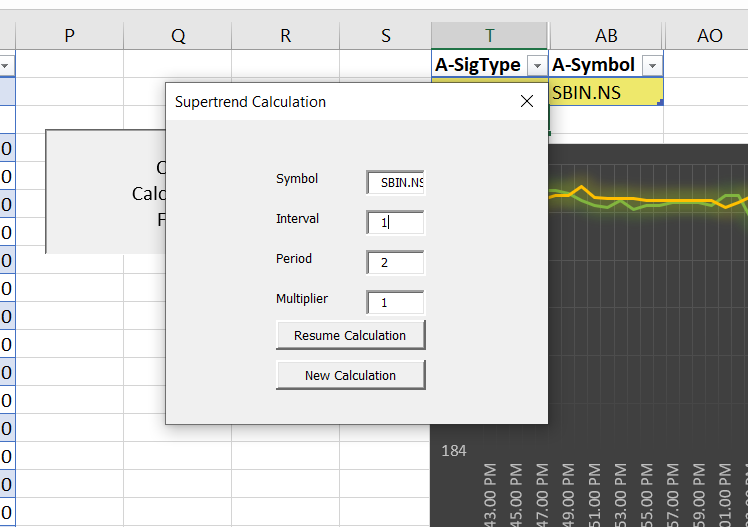
This dialog box has 4 parameters that the user needs to provide:
- Symbol – NSE Symbol (Note: Symbol name should be the same as in Yahoo Finance ending with .NS)
- Interval – The time interval in minutes
- Period – The period value for the Supertrend calculation (>1)
- Multiplier – The multiplier value for the Supertrend calculation
There are two command buttons that will begin the calculations:
- Resume Calculation – This option will only appear if there was some previous data on the sheet. You can choose this option if you want to continue with the previous calculation.
- New Calculation – This option will clear all previous data if it was available and begin fresh calculation.
The last Trade Price along with the Time of last trade will be available on the last row of the sheet. It will be updated on regular basis. Although other values like open, close, high, low, super-trend would be updated at end of the interval.
There is a downward trend expectation when the super trend indicator is above the close price. Similarly, we can expect the opposite trend when the indicator is below the close price.
Further, the LE and SE columns indicate the entry and exit. When the LE value changes from 0 to 1 in the column it shows entry and when the value changes from 1 to 0 in the column, it indicates exit. The same goes for SE as well.
The current strategy makes alternate short and long trades, starting from the first crossover.
SuperTrend Signal Conditions
If at the end of an interval, the close value super trend indicator flips with respect to the closing price. Then an event might trigger:
Entry and Exit Events
- For the first crossover, a Long entry will be triggered if the super trend indicator was previously moving above the close prices and now flips the side, similarly a Short entry will be triggered if the super trend indicator was previously moving below the close prices and now flips the side.
- When a long entry has been taken and the super trend indicator was previously moving below the close prices and now flips the side, Long Exit is triggered and Short Entry is taken (reverse).
- If a short entry has been taken and the super trend indicator was previously moving above the close prices and now flips the side, Short Exit is triggered and Long Entry is taken (reverse).
Plotting SuperTrend Chart in Excel
This chart is for trend visualization. The green trendlines visualize closing price and the golden trendline visualizes the super trend indicator. You can find the crossovers here.
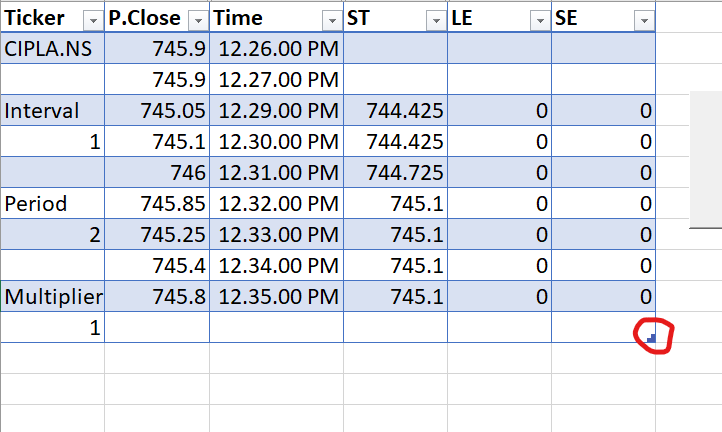
Note: You will need to table size to obtain the chart visual. Drag the blue corner to the size of the table which you want to visualize in the chart.
Recent Discussion