
APPLYING RENKO ON NORMAL CANDLES
Limitations on Renko traditional charts:
- Trading view free/pro users cant access Renko charts for intraday.
- It shows wrong back testing results. When we apply strategy on Renko charts/Heikin ashi , it would show best profit curve but that’s unreal because Renko and heikin ashi have so much of variation from real market price.
- Above all it actually has chance to mislead people that Renko is best always.
Therefore we are going to setup an alternative Renko strategy which can be applied on normal candlestick charts.
Advantages of Renko strategy with normal candles over traditional:
- The price is related to real markets and logic is related to Renko block building this strategy will reduce slippages when applied on real markets.
- Trading view free users /pro users who cannot access Renko charts can use this to apply Renko on normal charts.
Therefore Renko charts design are in such a way that it filter out minor price movements to make it easier for traders to focus on important trends and price action. This makes trends much easier to spot, Because we can remove those small fluctuations, so price trends may be easier to spot, and that feature makes Renko charts the preferred price chart for some traders.
A Renko chart is constructed from a series of bricks. whose creation is determined by fluctuations in price. For Instance when a price rises, an up brick is placed on the chart and, with drop of prices a down brick is added.
We will demonstrate you on how you can find one simple Renko strategy and automate its trades
Strategy Premise:
Logic is based on Renko block building, price is related to real markets.
Inputs:
1. We will specify the brick size from the input
2. Trade session during which we want to buy/sell signals will be generated
3 .Exit session during which all open positions are squared of
4. We will give quantity to trade as input
We have two boundaries, the upper one and the lower one, they are calculated based on brick size. We will have trend (represented in color of the upper or lower bound lines)
Trend Green–>Long
Trend Red–>Short
Strategy Logic:
Long Entry: When Upper Boundary is touched, send LE.
Long Exit: When Lower Boundary is touched, or time based exit, send LX.
Short Entry: When Lower Boundary is touched, send SE.
Short Exit: When Upper Boundary is touched, or time based exit, send SX.
TradingView Settings:
STEP 1: First download the pinsecript file here.
STEP 2: Open desired chart in trading view with normal candlestick ,select desired time-frame of the chart. Go to pine editor section , remove the default code , paste the downloaded code,save the file and add to chart.

STEP 3: Once we apply strategy on chart, click on settings to optimize parameters for your own trading.
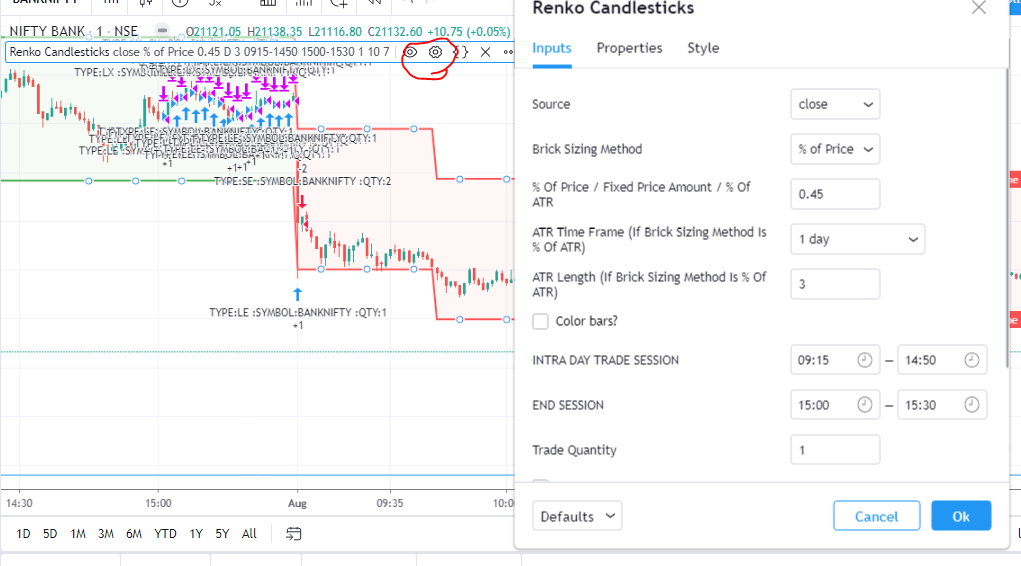
- Source: It can be a source factor of price in which strategy is computed ex: close,open,hl2,etc.
- Brick sizing method : Renko is formed by bricks. There are 3 ways to calculate brick size, Fixed brick, ATR,% of close price.
- % of price/Fixed price amount/% of ATR: Use this to specify % of brick size as input/fixed brick size / %of ATR used for brick size.
- ATR time frame: ATR is an Average true range of past bars ,use this to select time frame to calculate ATR.
- ATR length: Specify ATR length if Brick type is ATR.
- Intraday trade session: You can take Entry trades only on this session.
- EXIT SESSION: Square off trade during this time frame.
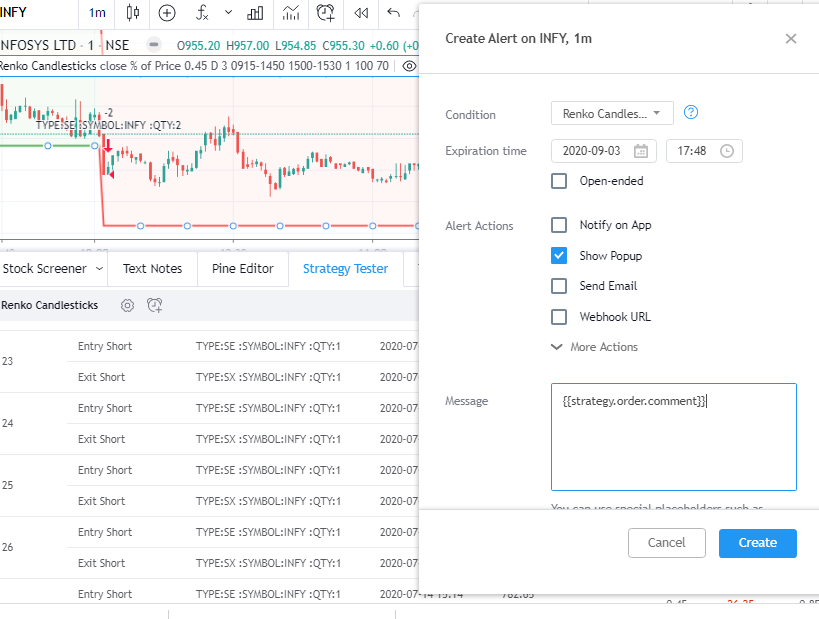
STEP 4: Settings Alerts for Auto Trading with APIBridge. Just paste {{strategy.order.comment}} in alert window. That’s all, you are ready to trade!
Do you want coding help to deploy your own strategy for live trading? Check our coding assistance.
The strategy can applying on a single script only. How to apply on watchlist !
IF I APPLY FIXED PRICE AMOUNT AS SIZING METHOD, WILL IT REPAINTS!