
The Bridge maintains logs at different levels for convenience and audit.
You can find the following five tabs for filtered logs on the main window – All, Trading, Connectivity, Error, External Modules.
All: This tab shows the most relevant messages for users of all types. It also shows messages sent by Admin (if any).
Trading: This tab shows only trading-related messages about signals received and orders placed.
Connectivity: This tab shows connectivity-related messages with Admin and Broker API.
Error: This tab shows only Broker API errors. It also has a button with each error- Report To Broker. You can copy the API request-response and send it to your broker’s technical team.
External Modules: This tab shows logs of any external modules (if any).
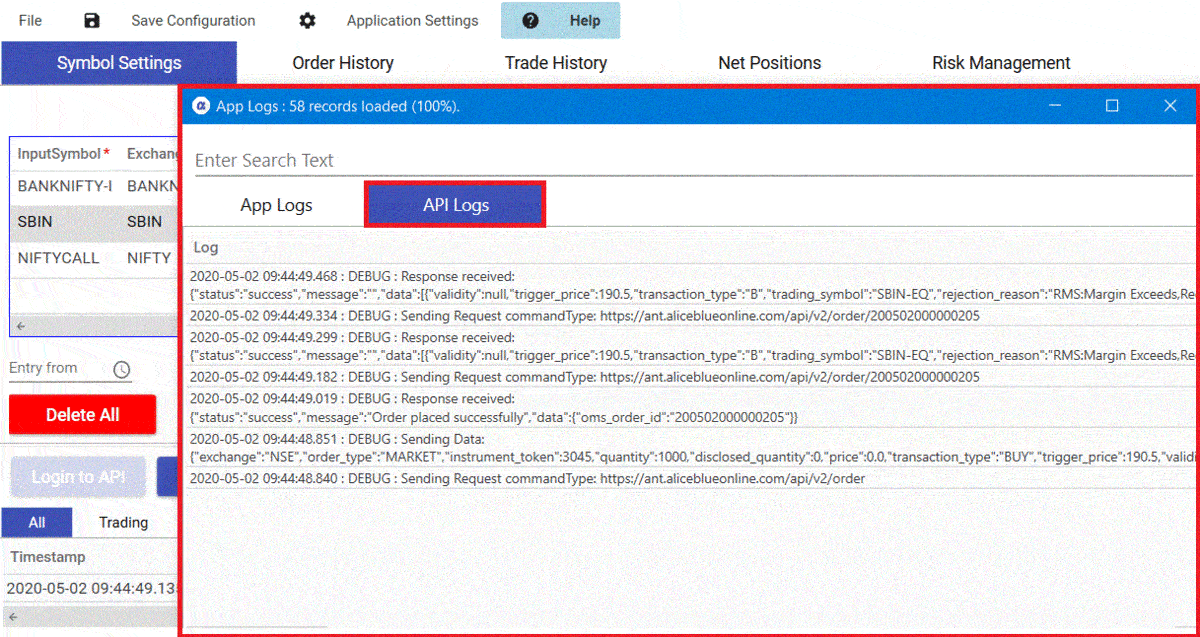
You can also click Show Full Logs to diagnose any issue in complete detail. Show Full Log button opens a window with two tabs – App Logs and API Logs. Studying these logs requires a basic understanding of how trading APIs work. For example, you can search for SBIN- at which time its signal was received, how all order placement parameters were calculated, etc. You can also press Ctrl+C after selecting a particular log, to share with your broker’s technical team or your developer.
App Logs refer to processing done by Bridge. You can also search among logs using a symbol name or any keyword.
API Logs refer to Broker API messages. You can see how the request was placed for order placement or cancellation. You can also check the response from Broker API.
Recent Discussion